Transforms
Transforms modify results before they are plotted. They are executed in the order they appear in the configuration.
Rebinning and Slicing
The RebinAxes and SelectAxesValues do more or less what they say.
Rebin simply rebins the given axes, merging every $N$ bins together.
Select picks a particular value from the chosen axis.
Postprocessing:
  default_plot_config:
    cms_text: "Open Data"
    image_type: ".png"
  processors:
    - name: Histogram1D
      inputs:
        - "*/*/*/Z1Mass"
      structure:
        group: {"dataset_name": "opendata_ZZTo4mu"}
        transforms:
          - name: SelectAxesValues
            select_axes_values: {variation: [central]}
          - name: RebinAxes
            rebin: {Z1_mass: 5}
      output_name: "{prefix}/rebin_{dataset_name}.png"
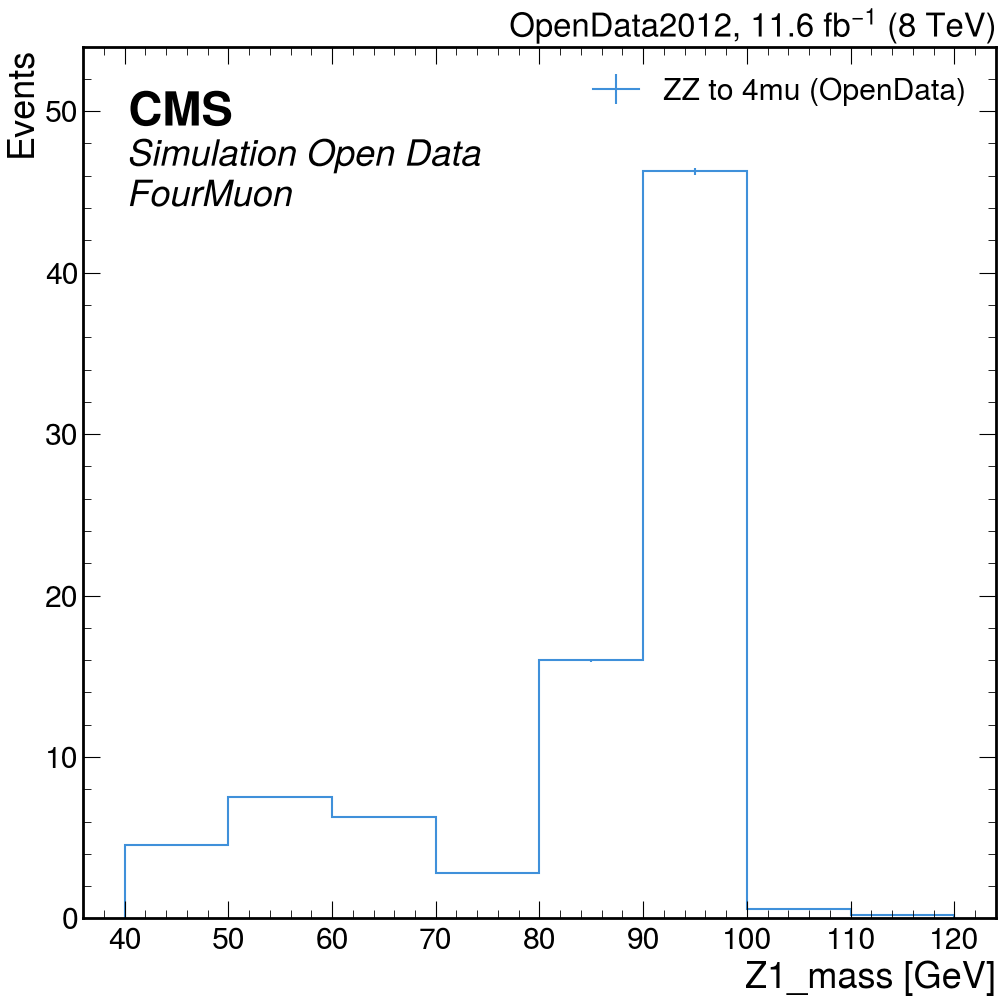
rebin_opendata_ZZTo4mu
Slicing
The SliceAxes transform can restrict a histogram to a specific range of values.
Postprocessing:
  default_plot_config:
    cms_text: "Open Data"
    image_type: ".png"
  processors:
    - name: Histogram1D
      inputs:
        - "*/*/*/Z2Mass"
      structure:
        group: {"dataset_name": "opendata_ZZTo4mu"}
        transforms:
          - name: SelectAxesValues
            select_axes_values: {variation: [central]}
          - name: SliceAxes
            slices: {Z2_mass: [40, 100]}
      output_name: "{prefix}/sliced_{dataset_name}.png"
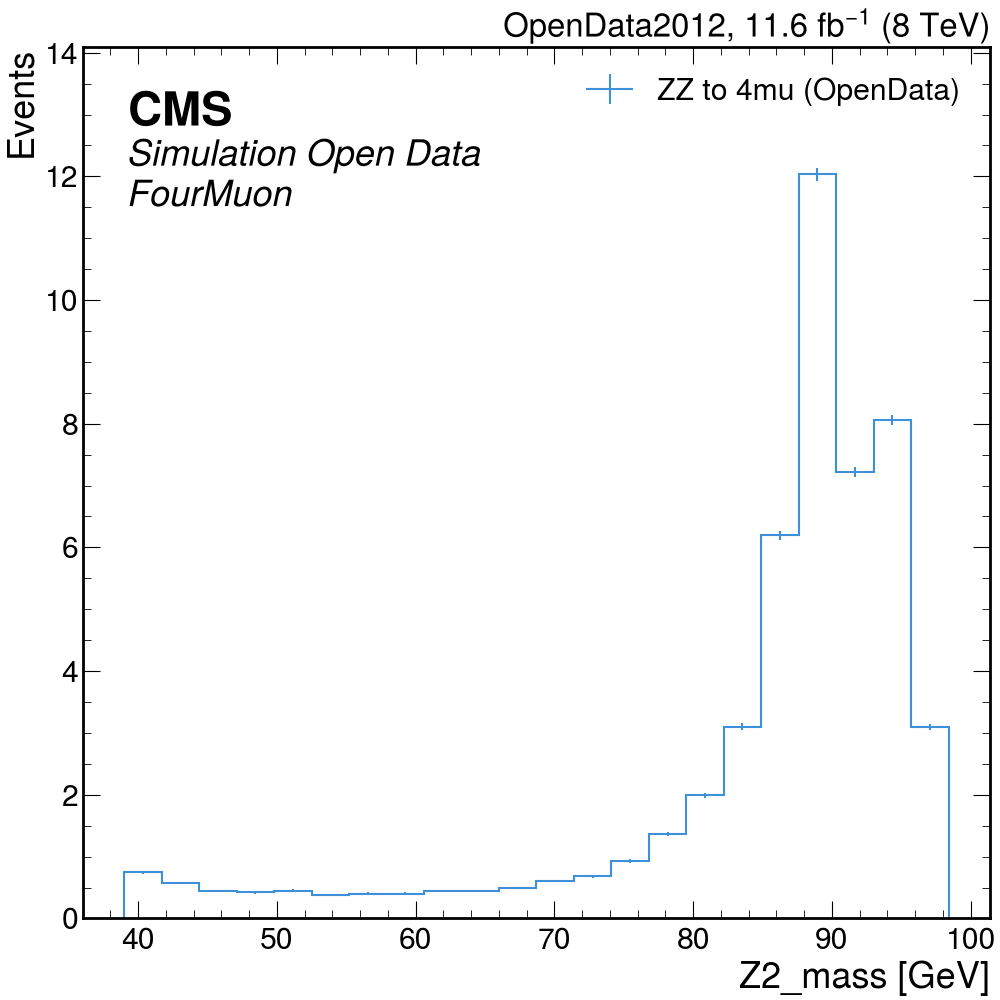
sliced_opendata_ZZTo4mu
Statistics and Formatting
The StatMaker transform calculates statistics (ie mean, median, std) for a histogram and stores them in the metadata.
They can then be used downstream, for example by FormatTitle.
Postprocessing:
  default_plot_config:
    cms_text: "Open Data"
    image_type: ".png"
  processors:
    - name: Histogram1D
      inputs:
        - "*/*/*/Z1Mass"
      structure:
        group: {"dataset_name": "opendata_ZZTo4mu"}
        transforms:
          - name: SelectAxesValues
            select_axes_values: {variation: [central]}
          - name: StatMaker
          - name: FormatTitle
            title_format: "Z1 Mass (Mean: {stats.mean} GeV, Std: {stats.std} GeV)"
      output_name: "{prefix}/stats_{dataset_name}.png"
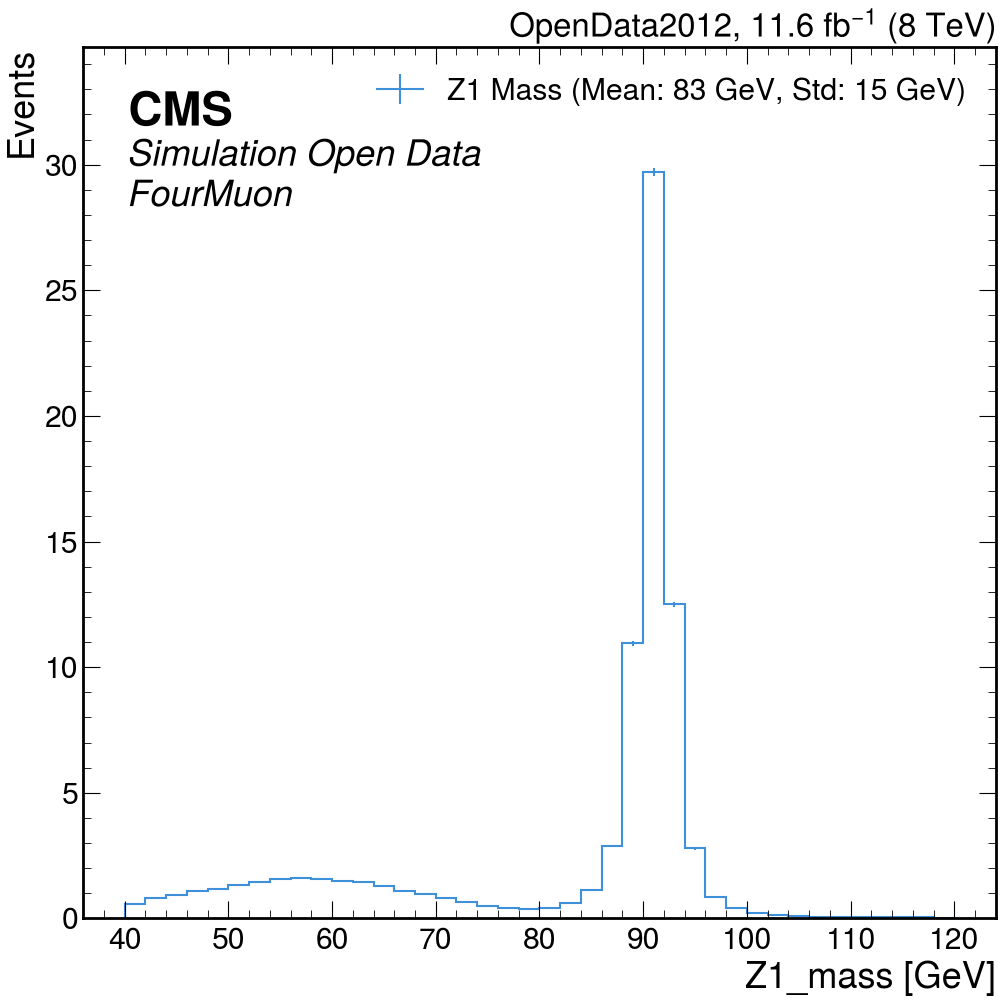
stats_opendata_ZZTo4mu
Splitting Axes
The SplitAxes transform can split a single multi-dimensional histogram into multiple independent histograms
based on the bins of a specific axis.
This is especially useful for user-generated categorical axes, a common example would be the multiplicity of some physics object like jets or lepton.
Postprocessing:
  default_plot_config:
    cms_text: "Open Data"
    image_type: ".png"
  processors:
    - name: Histogram1D
      inputs:
        - "*/*/*/Z1Mass"
      structure:
        group: {"dataset_name": "opendata_ZZTo4mu"}
        transforms:
          - name: SplitAxes
            split_axis_names: ["variation"]
      output_name: "{prefix}/split_{dataset_name}_{axis_params.variation}.png"
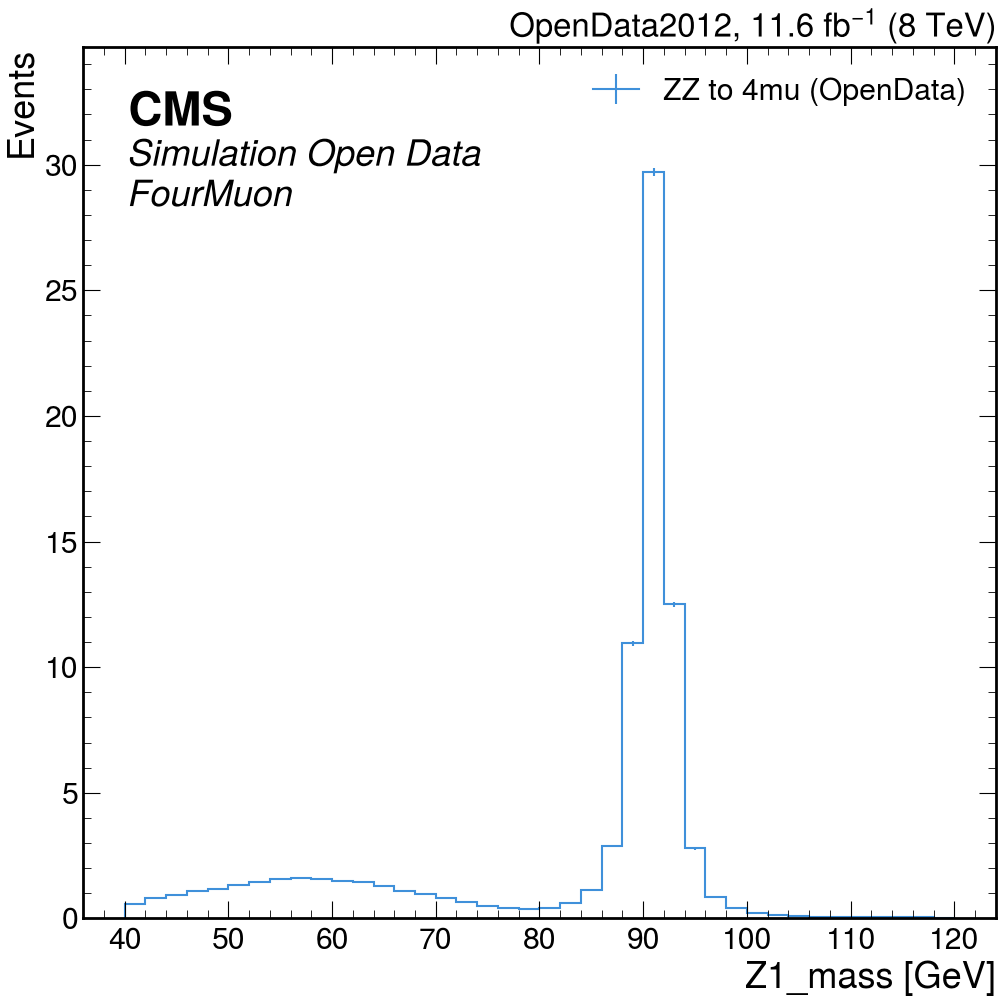
split_opendata_ZZTo4mu_central
Tip
This can be combined various grouping mechanics to, for example, split the systematics then plot them as a ratio.